Chapter 5 Data Pre-processing
Many data analysis related books focus on models, algorithms and statistical inferences. However, in practice, raw data is usually not directly used for modeling. Data preprocessing is the process of converting raw data into clean data that is proper for modeling. A model fails for various reasons. One is that the modeler doesn’t correctly preprocess data before modeling. Data preprocessing can significantly impact model results, such as imputing missing value and handling with outliers. So data preprocessing is a very critical part.

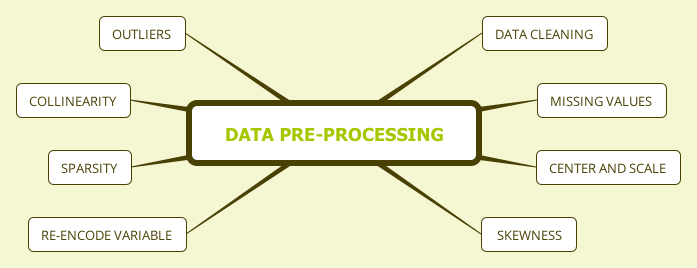
Data Pre-processing Outline
In real life, depending on the stage of data cleanup, data has the following types:
- Raw data
- Technically correct data
- Data that is proper for the model
- Summarized data
- Data with fixed format
The raw data is the first-hand data that analysts pull from the database, market survey responds from your clients, the experimental results collected by the research and development department, and so on. These data may be very rough, and R sometimes can’t read them directly. The table title could be multi-line, or the format does not meet the requirements:
- Use 50% to represent the percentage rather than 0.5, so R will read it as a character;
- The missing value of the sales is represented by “-” instead of space so that R will treat the variable as character or factor type;
- The data is in a slideshow document, or the spreadsheet is not “.csv” but “.xlsx”
- …
Most of the time, you need to clean the data so that R can import them. Some data format requires a specific package. Technically correct data is the data, after preliminary cleaning or format conversion, that R (or another tool you use) can successfully import it.
Assume we have loaded the data into R with reasonable column names, variable format and so on. That does not mean the data is entirely correct. There may be some observations that do not make sense, such as age is negative, the discount percentage is greater than 1, or data is missing. Depending on the situation, there may be a variety of problems with the data. It is necessary to clean the data before modeling. Moreover, different models have different requirements on the data. For example, some model may require the variables are of consistent scale; some may be susceptible to outliers or collinearity, some may not be able to handle categorical variables and so on. The modeler has to preprocess the data to make it proper for the specific model.
Sometimes we need to aggregate the data. For example, add up the daily sales to get annual sales of a product at different locations. In customer segmentation, it is common practice to build a profile for each segment. It requires calculating some statistics such as average age, average income, age standard deviation, etc. Data aggregation is also necessary for presentation, or for data visualization.
The final table results for clients need to be in a nicer format than what used in the analysis. Usually, data analysts will take the results from data scientists and adjust the format, such as labels, cell color, highlight. It is important for a data scientist to make sure the results look consistent which makes the next step easier for data analysts.
It is highly recommended to store each step of the data and the R code, making the whole process as repeatable as possible. The R markdown reproducible report will be extremely helpful for that. If the data changes, it is easy to rerun the process. In the remainder of this chapter, we will show the most common data preprocessing methods.
Load the R packages first:
# install packages from CRAN
p_needed <- c('imputeMissings','caret','e1071','psych',
              'car','corrplot')
packages <- rownames(installed.packages())
p_to_install <- p_needed[!(p_needed %in% packages)]
if (length(p_to_install) > 0) {
    install.packages(p_to_install)
}

lapply(p_needed, require, character.only = TRUE)