1.2 Data Science Role and Skill Tracks
A well-known Chinese parable tells the story of a group of blind men who attempt to conceptualize an elephant by touching it. The first person, whose touches the trunk, describes the being as a “thick snake.” The second, who touches the ear, perceives the elephant as a fan. The third, who touches the leg, likens it to a pillar-like tree trunk. The fourth, who touches the side, describes it as a wall. The fifth, who touches the tail, describes it as a rope. And the last, who touches the tusk, describes it as hard and smooth, like a spear.
Data science is the elephant. With the increasing popularity of data science, many professionals changed their titles to be “Data Scientist” without any necessary qualifications. Today’s data scientists come from vastly different backgrounds, each with their own unique perspective on what data science is and how it should be approached. And to make matters worse, most of us are not even fully aware of our conceptualizations, much less the uniqueness of the experience from which they are derived.
“We don’t see things as they are, we see them as we are. [by Anais Nin]”
So, the answer to the question “what is data science?” depends on who you are talking to. Data science has three main skill tracks (figure 1.1): engineering, analysis, and modeling/inference (and yes, the order matters!).
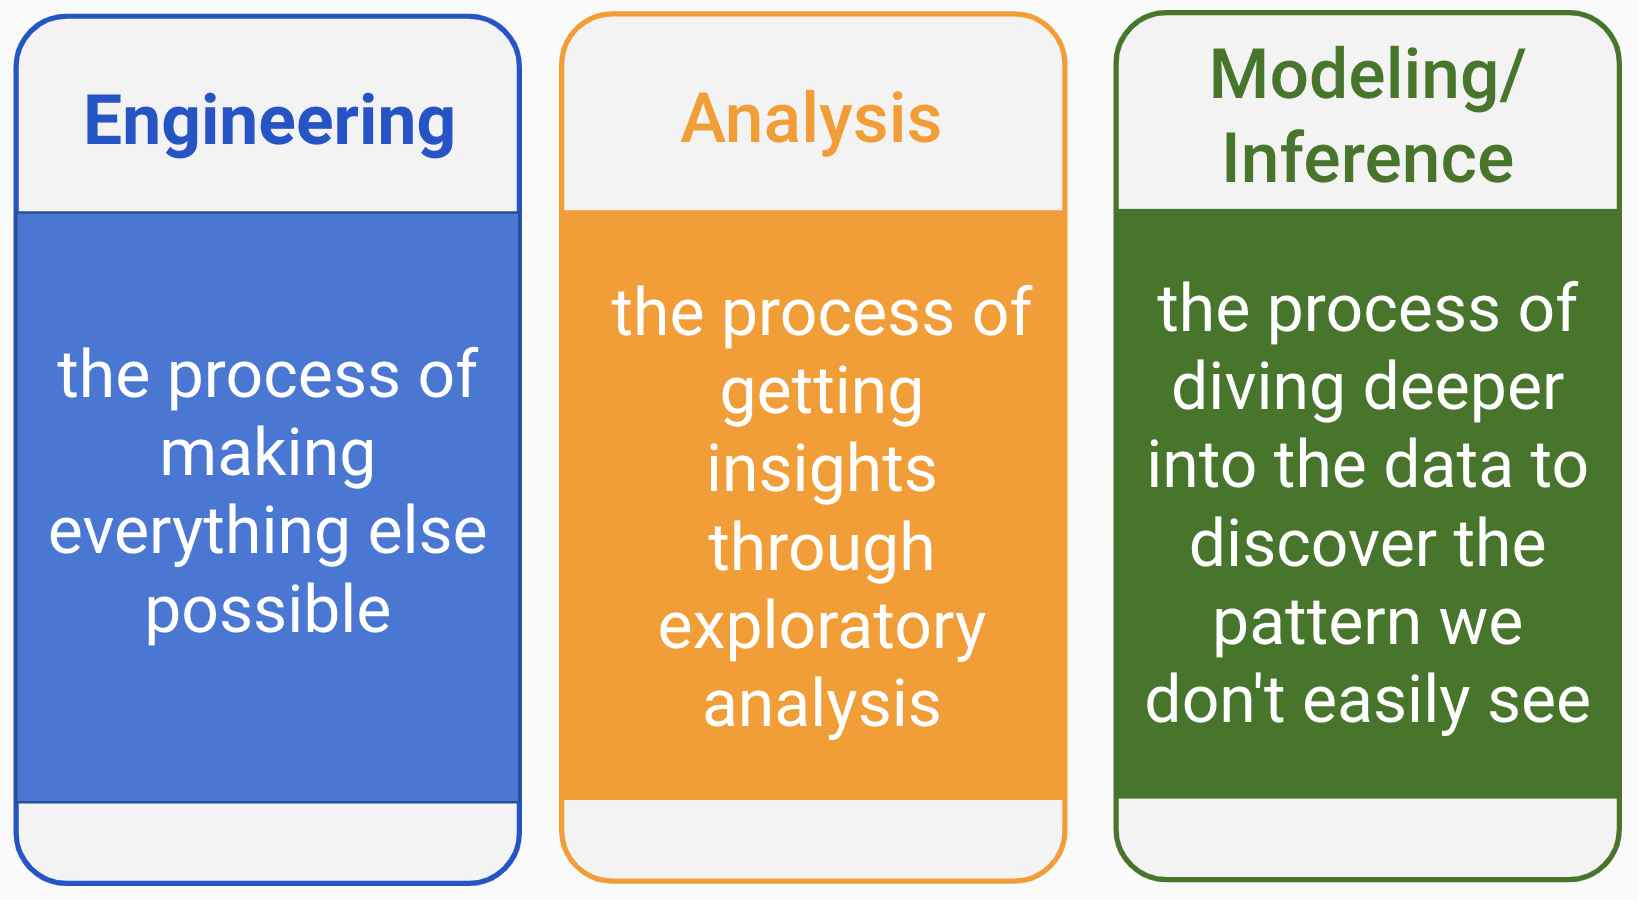
FIGURE 1.1: Three tracks of data science
There are some representative skills in each track. Different tracks and combinations of tracks will define different roles in data science. 1
When people talk about all the machine learning and artificial intelligence algorithms, they often overlook the critical data engineering part that makes everything possible. Data engineering is the unseen iceberg under the water surface. Does your company need a data scientist? You are only ready for a data scientist if you have a data engineer. You need to have the ability to get data before making sense of it. If you only deal with small datasets with formatted data, you can get by with plain text files such as CSV (i.e., comma-separated values) or spreadsheets. As the data increases in volume, variety, and velocity, data engineering becomes a sophisticated discipline in its own right.
1.2.1 Engineering
Data engineering is the foundation that makes everything else possible (figure 1.2). It mainly involves building data infrastructures and pipelines. In the past, when data was stored on local servers, computers, or other devices, constructing the data infrastructure was a major IT project. This included software, hardware for servers to store the data, and the ETL (extract, transform, and load) process.
With the advent of cloud computing, the new standard for storing and computing data is on the cloud. Data engineering today is essentially software engineering with data flow as the primary focus. The fundamental element for automation is maintaining the data pipeline through modular, well-commented code, and version control.
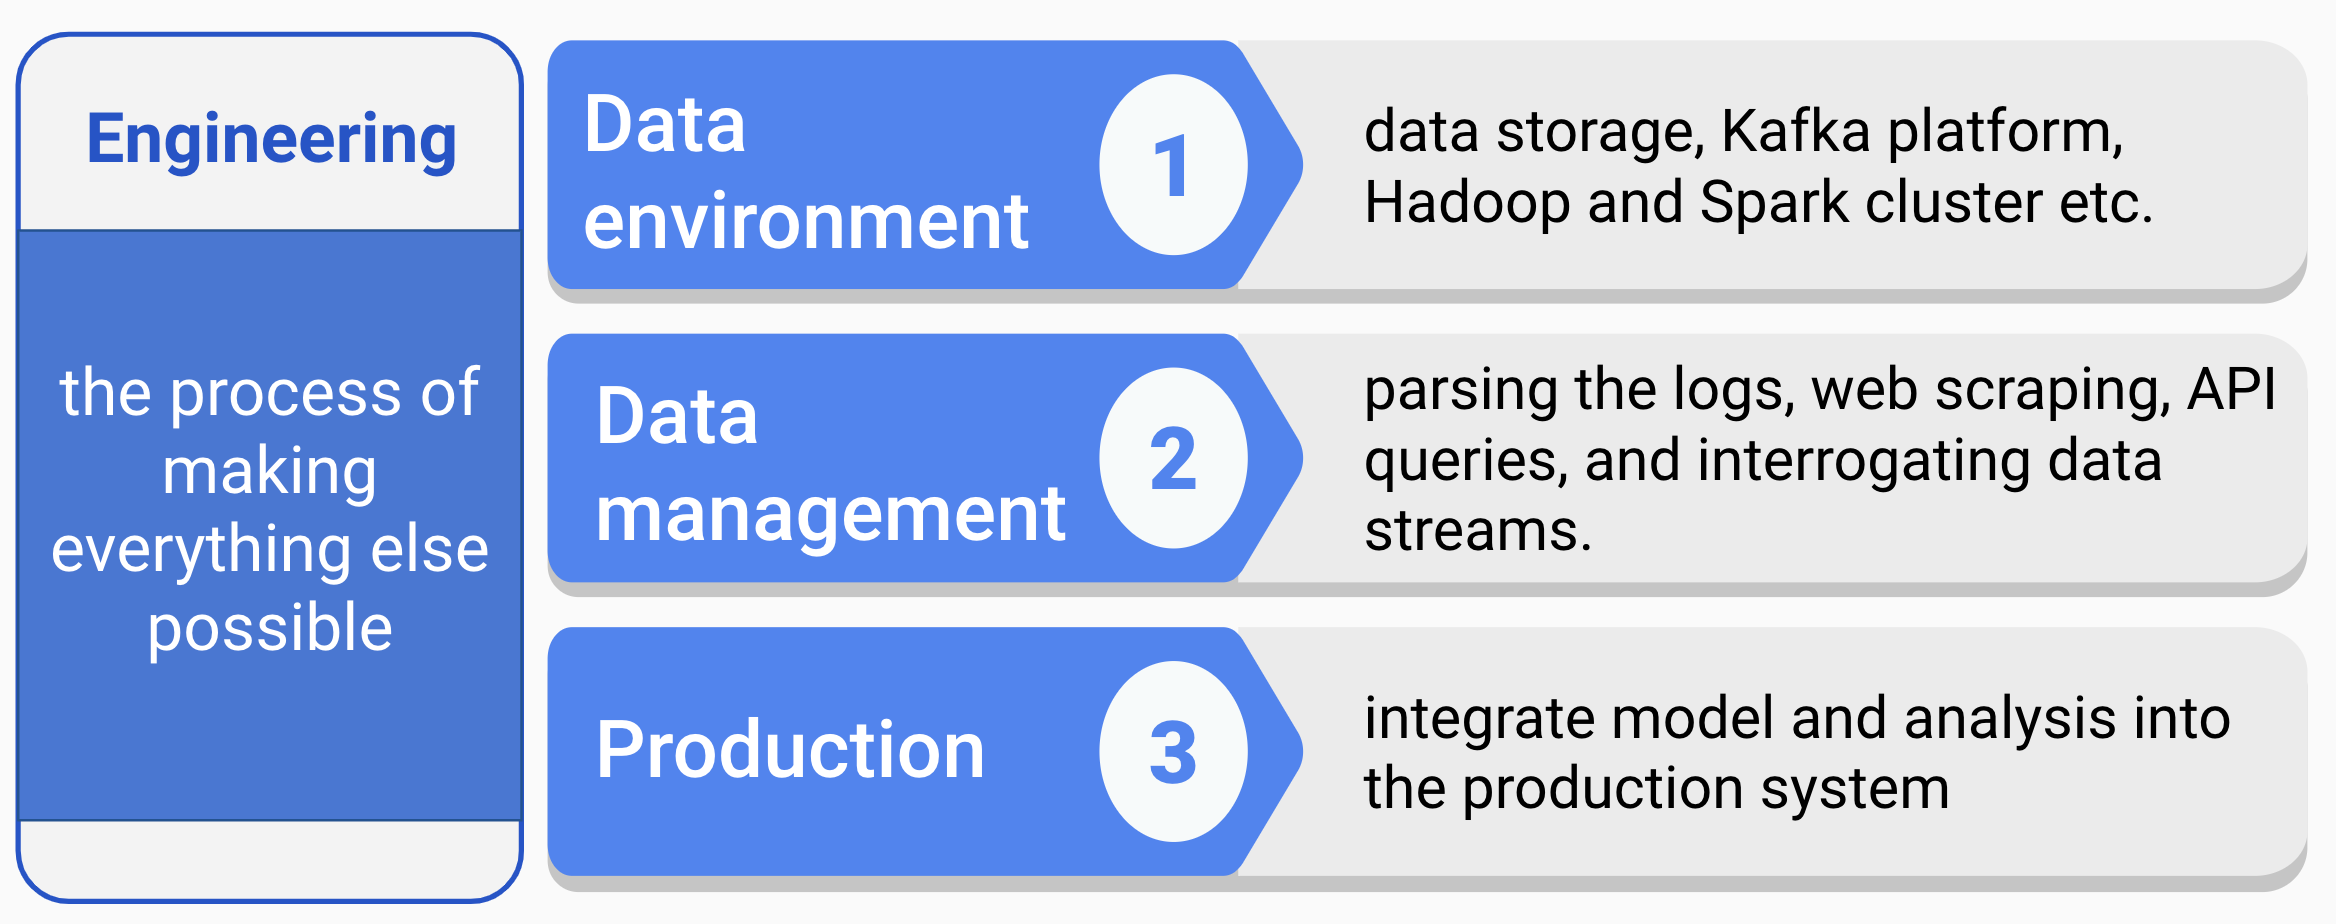
FIGURE 1.2: Engineering track
- Data environment
Designing and setting up the entire environment to support data science workflow is the prerequisite for data science projects. It includes setting up storage in the cloud, Kafka platform, Hadoop and Spark clusters, etc. Each company has a unique data condition and need. The data environment will be different depending on the size of the data, update frequency, the complexity of analytics, compatibility with the back-end infrastructure, and (of course) budget.
- Data management
Automated data collection is a common task that includes parsing the logs (depending on the stage of the company and the type of industry you are in), web scraping, API queries, and interrogating data streams. Data management includes constructing data schema to support analytics and modeling needs, and ensuring data is correct, standardized, and documented.
- Production
If you want to integrate the model or analysis into the production system, you have to automate all data handling steps. It involves the whole pipeline from data access, preprocessing, modeling to final deployment. It is necessary to make the system work smoothly with all existing software stacks. So, it requires monitoring the system through some robust measures, such as rigorous error handling, fault tolerance, and graceful degradation to make sure the system is running smoothly and users are happy.
1.2.2 Analysis
Analysis turns raw data into meaningful insights through a fast and often exploratory approach. To excel as an analyst, one must possess a solid understanding of the relevant domain, perform exploratory analysis efficiently, and be able to communicate findings through compelling storytelling (figure 1.3).
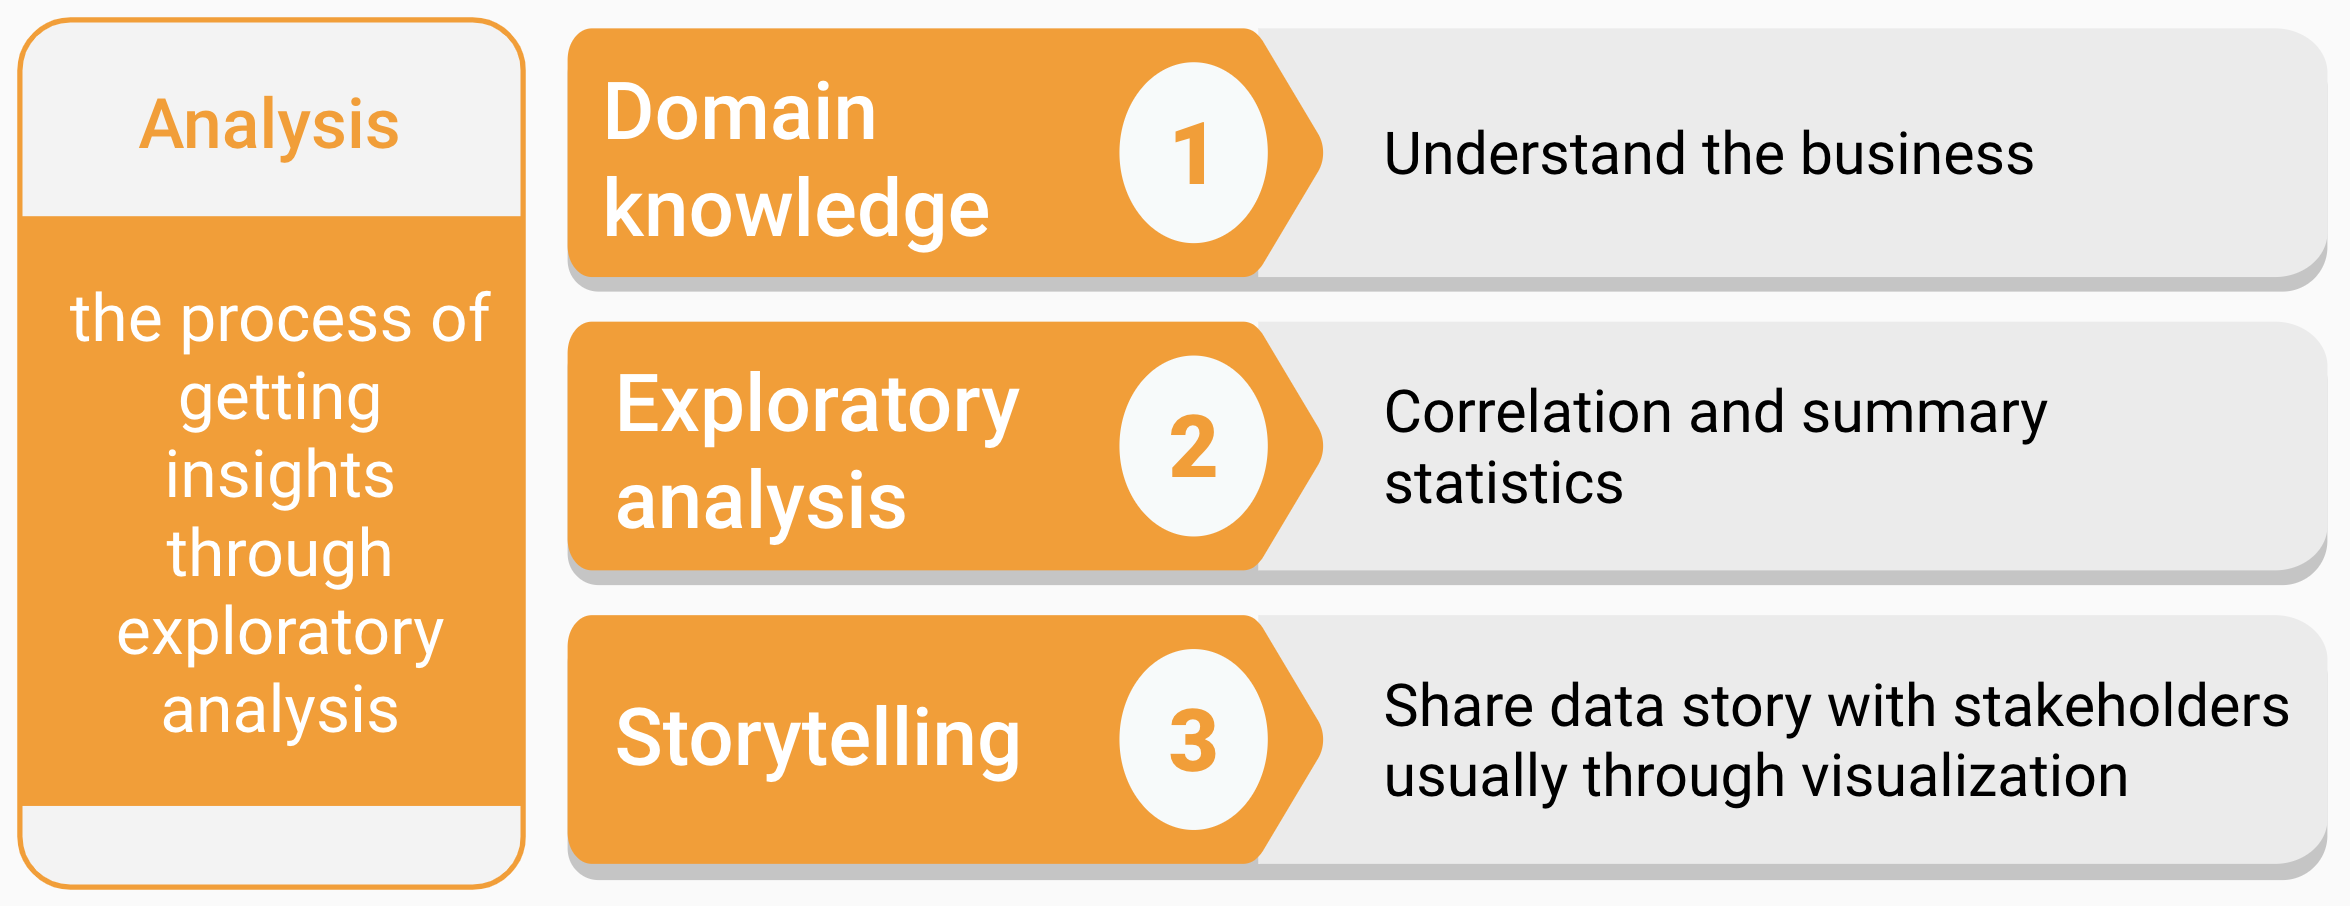
FIGURE 1.3: Analysis track
- Domain knowledge
Domain knowledge is the understanding of the organization or industry where you apply data science. You can’t make sense of data without context. Some questions about the context are
- What are the critical metrics for this kind of business?
- What are the business questions?
- What type of data do they have, and what does the data represent?
- How to translate a business need to a data problem?
- What has been tried before, and with what results?
- What are the accuracy-cost-time trade-offs?
- How can things fail?
- What are other factors not accounted for?
- What are the reasonable assumptions, and what are faulty?
Domain knowledge helps you to deliver the results in an audience-friendly way with the right solution to the right problem.
- Exploratory analysis
This type of analysis is about exploration and discovery. Rigorous conclusions are not the primary driver, which means the goal is to get insights driven by correlation, not causation. The latter one requires more advanced statistical skills and hence more time and resource expensive. Instead, this role will help your team look at as much data as possible so that the decision-makers can get a sense of what’s worth further pursuing. It often involves different ways to slice and aggregate data. An important thing to note here is that you should be careful not to get a conclusion beyond the data. You don’t need to write production-level robust codes to perform well in this role.
- Storytelling
Storytelling with data is critical to deliver insights and drive better decision making. It is the art of telling people what the numbers signify. It usually requires data summarization, aggregation, and visualization. It is crucial to answering the following questions before you begin down the path of creating a data story.
- Who is your audience?
- What do you want your audience to know or do?
- How can you use data to help make your point?
A business-friendly report or an interactive dashboard is the typical outcome of the analysis.
1.2.3 Modeling/Inference
Modeling/inference is a process that dives deeper into the data to discover patterns that are not easily seen. It is often misunderstood. When people think of data science, they may immediately think of complex machine learning models. Despite the overrepresentation of machine learning in the public’s mind, the truth is that you don’t have to use machine learning to be a data scientist. Even data scientists who use machine learning in their work spend less than 20% of their time working on machine learning. They spend most of their time communicating with different stakeholders and collecting and cleaning data.
This track mainly focuses on three problems: (1) prediction, (2) explanation, and (3) causal inference (figure 1.4)).
Prediction focuses on predicting based on what has happened, and understanding each variable’s role is not a concern. Many black-box models, such as ensemble methods and deep learning, are often used to make a prediction. Examples of problems are image recognition, machine translation, and recommendation. Despite the remarkable success of many deep-learning models, they operate almost entirely in an associational mode. As Judea Pearl pointed out in his book “The book of why” (Pearl and Mackenzie 2019), complex black-box algorithms like AlphaGo “do not really know why it works, only that it does.” Judea Pearl came up with a Ladder of Causation (Pearl and Mackenzie 2019) with three levels: 1) association, 2) intervention, and 3) counterfactuals. According to this framework, prediction problems are on the first level.
The next level of the ladder, intervention, requires model interpretability. Questions on this level involve not just seeing but changing. The question pattern is like, “what happens if I do …?” For example, product managers often need to prioritize a list of features by user preference. They need to know what happens if we build feature a instead of feature b. Choice modeling is a standard method for this problem which allows you to explain the drivers behind users’ decisions on using/purchasing a product. Another way to directly study the result of an intervention is through experiments. Tech companies constantly perform A/B tests to examine what happens if they make some product change.
Causal inference is on the third level, which is counterfactual. When an experiment is not possible, and the cost of a wrong decision is too high, you need to use the existing data to answer a counterfactual question: “what would have happened if I had taken a different approach?” For example, if you are a policymaker who wants to find a way to reduce the divorce rate in the United States, you see from the data the southern states have a higher divorce rate and a lower median age at marriage. You may assume that getting married when you are young leads to a higher chance of divorce. But it is impossible to experiment by randomly selecting a group of people and asking them to get married earlier and the other group to get married later as a control. In this case, you must find a way to match samples or create a balanced pseudo-population. This type of problem is out of the scope of this book. For a non-technical introduction to causal inference, readers can refer to “The book of why” (Pearl and Mackenzie 2019).
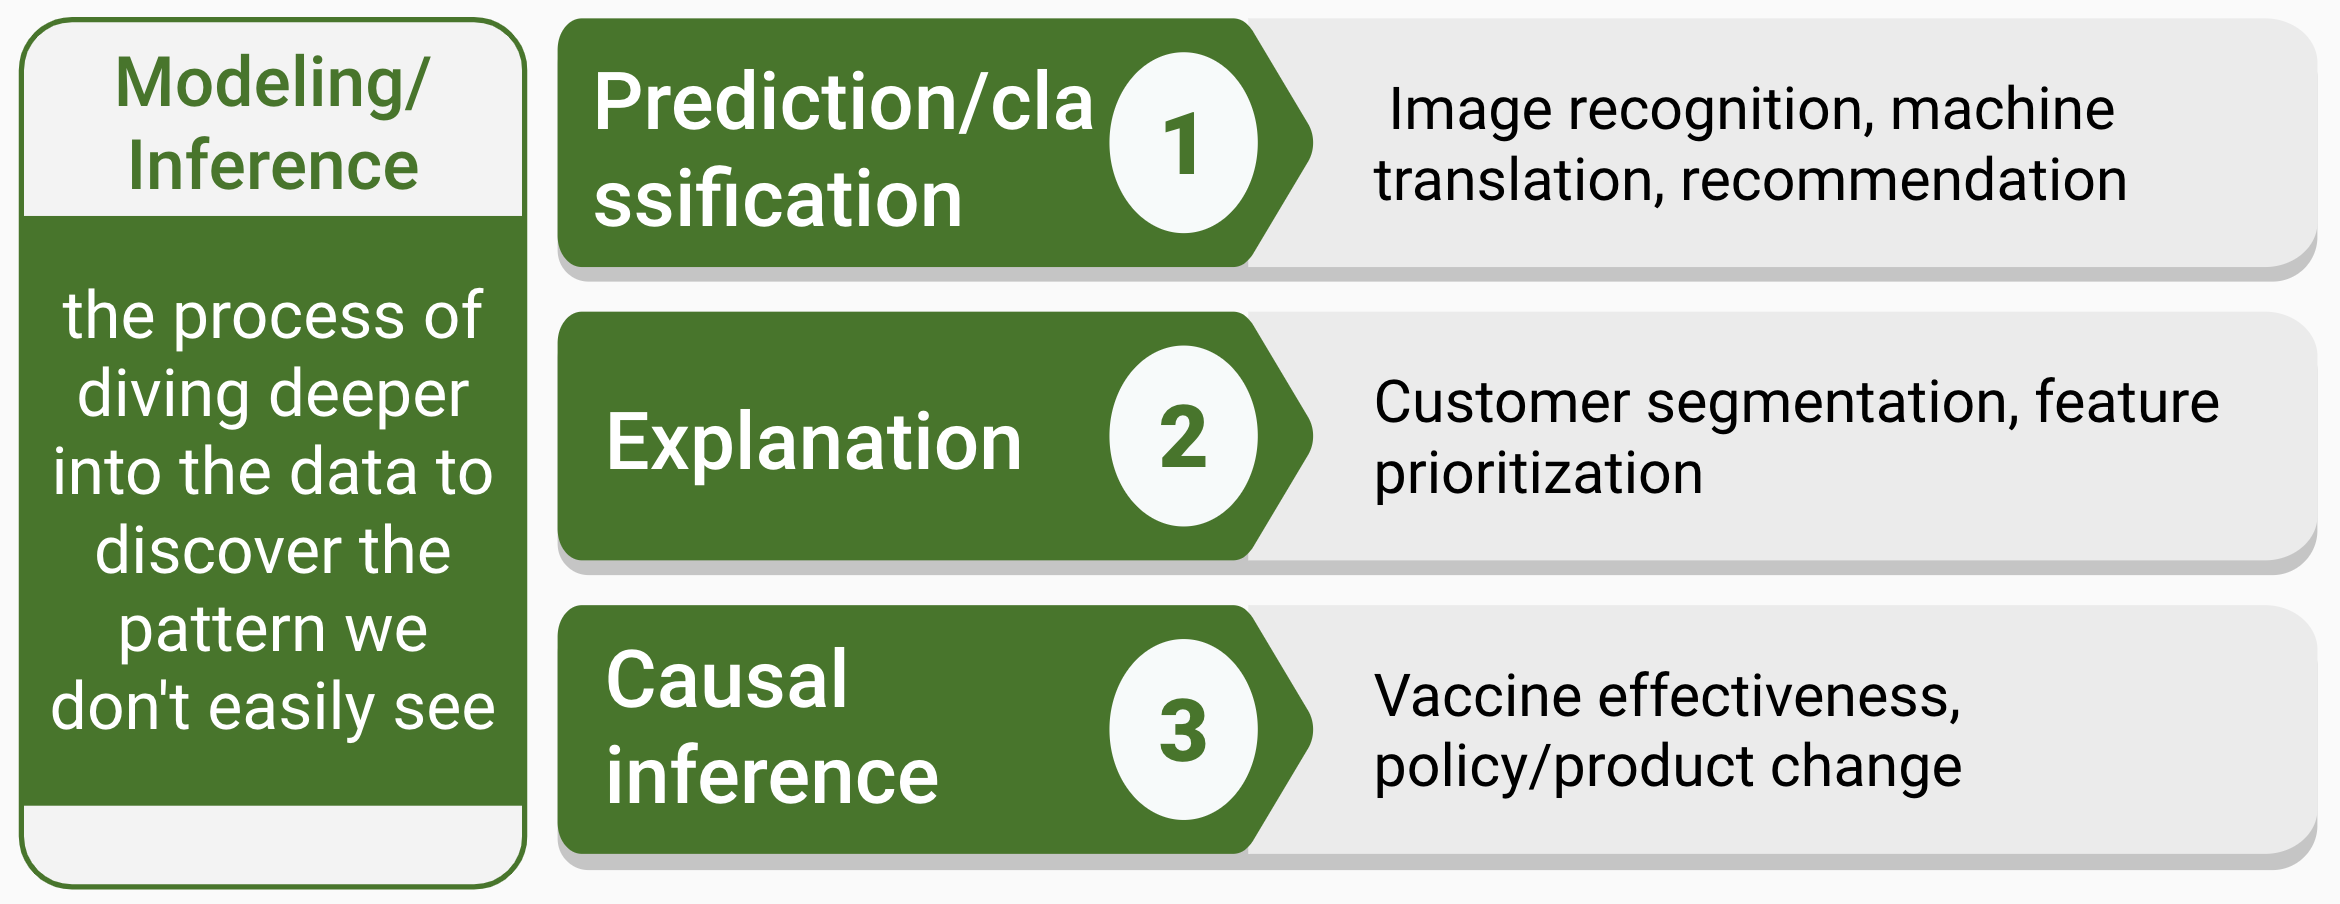
FIGURE 1.4: Modeling/inference track
If we look at this track through the lens of the technical methods used, there are three types.
- Supervised learning
In supervised learning, each sample corresponds to a response measurement. There are two flavors of supervised learning: regression and classification. In regression, the response is a real number, such as the total net sales in 2017 for a company or the yield of wheat next year for a state. The goal for regression is to approximate the response measurement. In classification, the response is a class label, such as a dichotomous response of yes/no. The response can also have more than two categories, such as four segments of customers. A supervised learning model is a function that maps some input variables (X) with corresponding parameters (beta) to a response (y). The modeling process is to adjust the value of parameters to make the mapping fit the given response. In other words, it is to minimize the discrepancy between given responses and the model output. When the response y is a real value number, it is intuitive to define discrepancy as the squared difference between model output and the response. When y is categorical, there are other ways to measure the difference, such as the area under the receiver operating characteristic curve (i.e., AUC) or information gain.
- Unsupervised learning
In unsupervised learning, there is no response variable. For a long time, the machine learning community overlooked unsupervised learning except clustering. Moreover, many researchers thought that clustering was the only form of unsupervised learning. One reason is that it is hard to define the goal of unsupervised learning explicitly. Unsupervised learning can be used to do the following:
Identify a good internal representation or pattern of the input that is useful for subsequent supervised or reinforcement learning, such as finding clusters;
It is a dimension reduction tool that provides compact, low dimensional representations of the input, such as factor analysis.
Provide a reduced number of uncorrelated learned features from original variables, such as principal component regression.
- Customized model development
In most cases, after a business problem is fully translated into a data science problem, a data scientist needs to use out of the box algorithms to solve the problem with the right data. But in some situations, there isn’t enough data to use any machine learning model, or the question doesn’t fit neatly in the specifications of existing tools, or the model needs to incorporate some prior domain knowledge. A data scientist may need to develop new models to accommodate the subtleties of the problem at hand. For example, people may use Bayesian models to include domain knowledge as the modeling process’s prior distribution.
Here is a list of questions that can help you decide the type of technique to use:
Is your data labeled? It is straightforward since supervised learning needs labeled data.
Do you want to deploy your model at scale? There is a fundamental difference between building and deploying models. It is like the difference between making bread and making a bread machine. One is a baker who will mix and bake ingredients according to recipes to make a variety of bread. One is a machine builder who builds a machine to automate the process and produce bread at scale.
Is your data easy to collect? One of the major sources of cost in deploying machine learning is collecting, preparing, and cleaning the data. Because model maintenance includes continuously collecting data to keep the model updated. If the data collection process requires too much human labor, the maintenance cost can be too high.
Does your problem have a unique context? If so, you may not be able to find any off-the-shelf method that can directly apply to your question and need to customize the model.
What others?
There are some common skills to have, regardless of the role people have in data science.
- Data preprocessing: the process nobody wants to go through yet nobody can avoid
No matter what role you hold in the data science team, you will have to do some data cleaning, which tends to be the least enjoyable part of anyone’s job. Data preprocessing is the process of converting raw data into clean data.
- Data preprocessing for data engineer
Getting data from different sources and dumping them into a data lake. A data lake is a storage repository that stores a vast amount of raw data in its native format, including XML, JSON, CSV, Parquet, etc. It is a data cesspool rather than a data lake. The data engineer’s job is to get a clean schema out of the data lake by transforming and formatting the data. Some common problems to resolve are
- Enforce new tables’ schema to be the desired one
- Repair broken records in newly inserted data
- Aggregate the data to form the tables with a proper granularity
- Data preprocessing for data analyst and scientist
Not just for a data engineer, preprocessing also occupies a large portion of data analyst and scientist’s working hours. A facility and a willingness to do these tasks are a prerequisite for a good data scientist. If you are lucky as a data scientist, you may end up spending 50% of your time doing this. If you are like most of us, you will probably spend over 80% of your working hours wrangling data.
The data a data scientist gets can still be very rough even if it is from a nice and clean database that a data engineer sets up. For example, dates and times are notorious for having many representations and time zone ambiguity. You may also get market survey responses from your clients in an excel file where the table title could be multi-line, or the format does not meet the requirements, such as using 50% to represent the percentage rather than 0.5. In many cases, you need to set the data to be the right format before moving on to analysis.
Even the data is in the right format. There are other issues to solve before or during analysis and modeling. For example, variables can have missing values. Knowledge about the data collection process and what it will be used for is necessary to decide a way to handle the missing. Also, different models have different requirements for the data. For example, some models may require a consistent scale; some may be susceptible to outliers or collinearity; some may not be able to handle categorical variables, and so on. The modeler has to preprocess the data to make it proper for the specific model.
Most of the people in data science today focus on one of the tracks. A small number of people are experts on two tracks.