User-centered Metrics
Do you like my post? Treat me a coffee?
This article is based on an invited talk to the HyVee analytics team. The topics covered in this talk are:
- Why are user-centered metrics important?
- What are user-centered metrics?
- What are the popular frameworks of user metrics?
- What types of questions can we answer using the metrics?
Why is it important to measure?
Why do we talk about user-centered metrics?
If you can’t measure it, you can’t improve it. —— Peter Drucker
We need to measure to know what to improve, where to focus. For business analytics, it might mean revenue, user acquisition, or user retention. In personal life, it might be your retirement savings, time with your family. By thinking about a few key metrics at work or in life, we help focus ourselves to achieve goals that matter to us.
If we all agree that measuring is important. The next question is what to measure. Before we get to different frameworks, let us start with a caveat.
When a measure becomes a target, it ceases to be a good measure. —— Goodhart’s Law
There are abundant examples of this phenomenon in the real world. During the British rule of colonial India, the British government tried to reduce the number of venomous snakes in Delhi by offering a reward for every cobra. Almost immediately, people were turning in cobras. The plan seemed to be working until local people realized they could create their own income stream by breeding cobras. Once the government caught this, the reward program was put to an end, leaving breeders with snakes that could no longer be exchanged for money. When these snakes were set free, the cobra problem became even worse.
When the thing you are measuring becomes the target, you excel at hitting the measurement while failing to actually hit the more important target.
For business, over-focus on click-through rate for news or watch time on video can result in lower quality of the content, even fake news (think about the impact on society as a whole).
For personal life, if you measure the success of your life by money or promotion, then you may fail to care for your own health or spend little time with your family. In that sense, what you measure makes who you are. It is the same for a company.
What do companies usually track?
There are some metric frameworks for large-scale web products that well summarize the common metrics. Those metrics focus on the business or technical aspects of a product. And they are all extremely important and related to user experience.
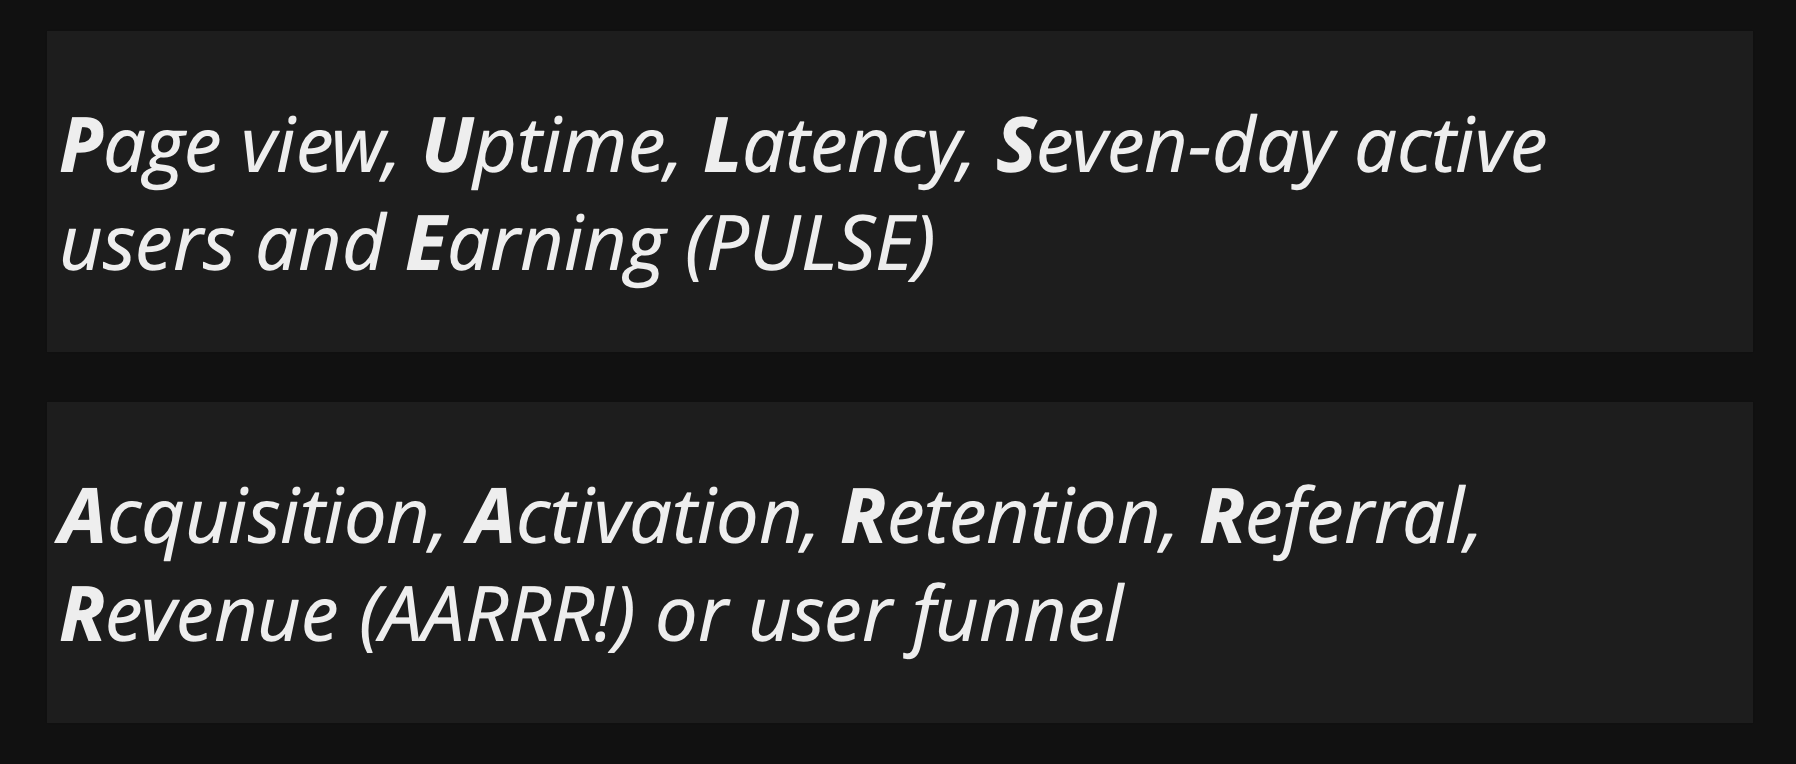
One of the popular frameworks is PULSE which stands for Pageviews, Uptime, Latency, Seven-day active users, and Earnings. It reflects a more low-level and direct approach to performance figures.
- Pageviews reveal the number of users visiting your site.
- Uptime gives the percentage of time the server infrastructure is up, running, and serving content.
- Latency gives a proper indication of the performance of your site infrastructure and your overall software development efforts on execution speed.
- Seven-day active users tell the number of users using your product or visiting your website within 7 days.
- Earnings give a good indication of if your business works or not.
Another important framework is AARRR (aka user funnel or Pirate Metrics, Dave McClure 2007), which stands for acquisition, activation, retention, referral, and revenue. It is widely accepted as the five most important metrics for SAAS companies. It is the pillar of understanding the basic user journey.
However, both of them are low-level and indirect metrics of user experience. And the interpretation is ambiguous. For example, are the two the same happy story?
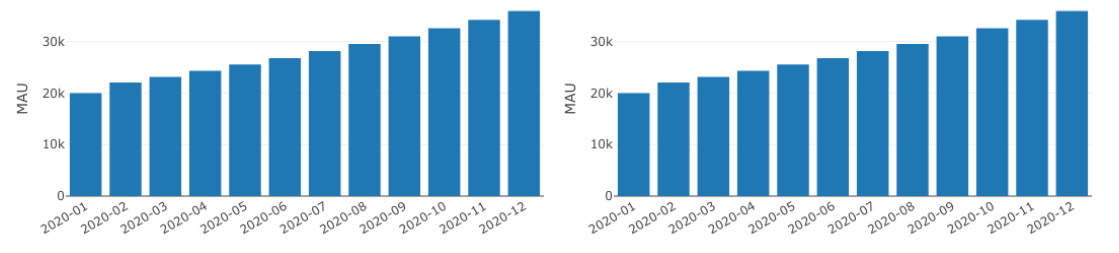
The counts of MAU are exactly the same for the two plots. But if you break them down into different categories, it reveals a very different story:
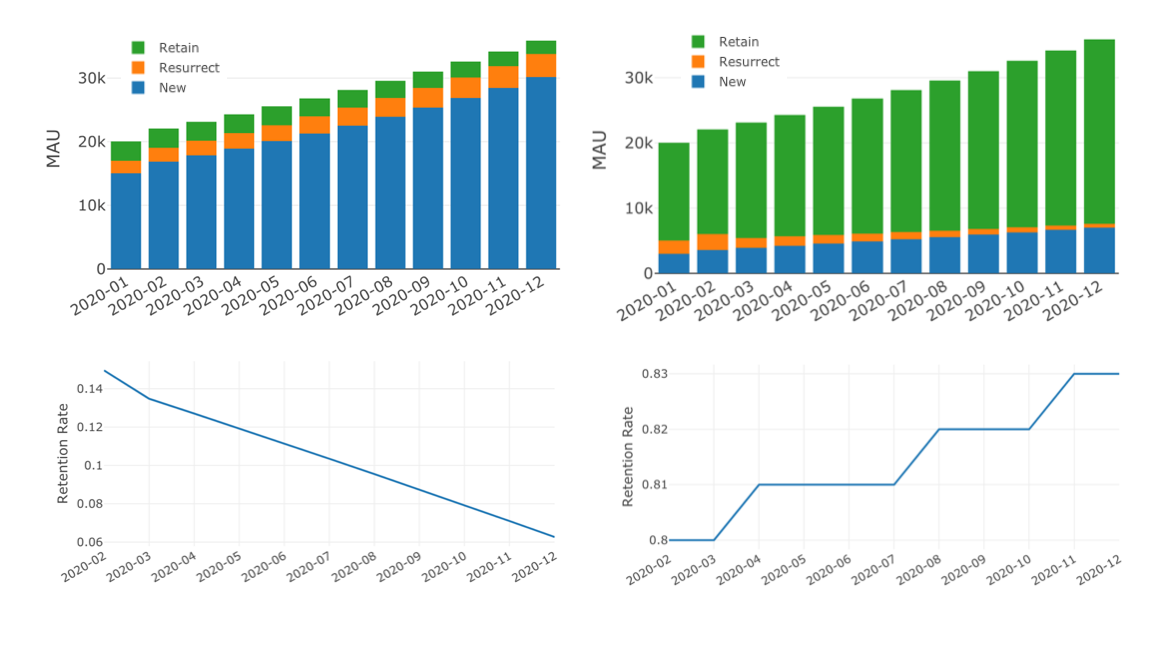
The growth on the left is fueled by new users. The retention has been dropping which is concerning. The growth on the right seems to be healthy. The growth is mostly from an increase in the retention rate and you see steady growth in new users too.
It is one step further but still doesn’t answer the question of why, why our customers retain? One caveat is that prediction and causal inference are two different questions. And being able to predict who is more likely to retain can’t necessarily give actionable suggestions on how to improve retention. Because the metrics only measure user behavior, not perception.
A user-centered metric tracking framework needs to consider both user perception and behavior. HEART is a popular framework that stands for Happiness, Engagement, Adoption, Retention, and Task Success.
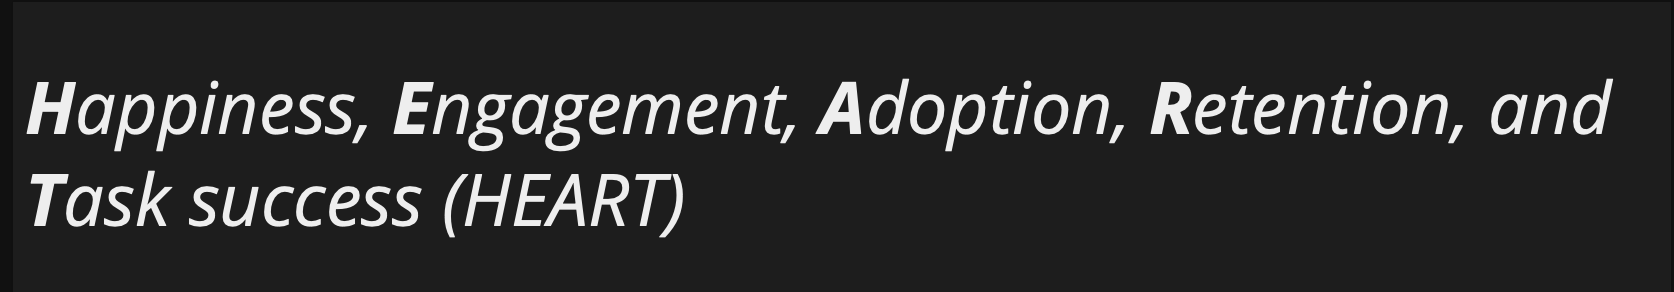
- Happiness and Task success are user experience metrics.
- Engagement, Adoption, and Retention are user behavior metrics.
It is not always appropriate to employ metrics from every category, but referring to the framework helps to make an explicit decision about what to include.
For example, engagement may not be meaningful in an enterprise context, if users are expected to use the product as part of their work (like Microsoft office). But it may still be meaning full to consider Engagement as a feature level, rather than the overall product level. Another example is Microsoft’s internet explorer, the user experience is not good but it is hard to detect that from user engagement because there are not too many other choices.
Now let’s look at each of these metric categories.
Happiness
User happiness metrics are attitudinal in nature and often tracked using surveys.
- Satisfaction
- Visual appeal
- Likelihood to recommend
- Perceived ease of use
For example, change aversion after a major redesign. And there is a nice article on it by a Google Quant Researcher: Change aversion: why users hate what you launched (and what to do about it)
Engagement
It indicates users’ level of involvement with a product:
- frequency: number of visits per user per week
- intensity: number of minutes per user per day
- depth of interaction over time: number of features used per user per week
For example, the Gmail team chose the percentage of active users who visited the product on five or more days during the last week as the measure of user engagement.
Adoption and Retention
Provide insight into active users and address the problem of distinguishing new users from existing users
- Adoption: How many users start using a product during a given time period
- Retention: How many of the users from a given time period are still present in some later time period
It can be tricky to define “active” or “using a product”.
For example, Netlify had a surge in signup during a company-held tech conference. However, the daily active users didn’t change that much.
Task success
Behavioral metrics of user experience
- efficiency (time to complete a task)
- effectiveness (percent of tasks completed)
- error rate (percent of failure)
Depending on the task, it can be difficult to track using the weblog because it is unclear which task the user was trying to accomplish.
For example, the task success of a search query is much harder to get than the task success of signup.
What questions to answer using the metrics?
The following is a summary of the types of questions you can answer using the metrics.
- Comparison:
- Are males more inclined to buy our products than females?
- Are there any differences in customer satisfaction for different user groups?
- Description:
- Is the distribution of annual income normal?
- Are there outliers?
- What are the mean satisfaction rates of different customer segments?
- Clustering:
- Which customers have similar product preferences?
- Which printer performs a similar pattern to the broken ones?
- How many different themes are there in the corpus?
- Classification:
- Who is more likely to buy our product?
- Is the borrower going to pay back?
- Is it spam?
- Regression:
- What is the projected net income for the next season?
- How much inventory should we have?
- What is the utility of each feature in a max-diff study?
- Optimization:
- What is the best route to deliver the packages?
- What is the best price to maximize the total net revenue?
- What is the optimal advertisement strategy to promote a new product?

This work is licensed under a Creative Commons Attribution-NonCommercial-ShareAlike 3.0 Unported License.